Over the past decade, researchers, policy makers, and practitioners have increasingly come to recognize the importance of quality in early care and education. Along with this recognition is compelling evidence that sound administrative practices help ensure high-quality learning opportunities for young children.1, 2, 3 Since its first publication in 2004, the Program Administration Scale: Measuring Early Childhood Leadership and Management (PAS) has been used across the country to reliably measure and improve center-based leadership and management practices. In 2011, the second edition of the PAS was published and included updated national norms and refinements reflecting best practices in early childhood program administration.4 Data collected by the McCormick Center for Early Childhood Leadership since 2011 are examined here to provide the most current picture of the administrative practices of a large, national sample of center-based programs.
SAMPLE AND METHODOLOGY
The PAS includes 25 items clustered in 10 subscales, which measure both leadership and management practices of center-based early care and education programs.4 Each item is scored on a scale of 1 to 7, with 1 representing inadequate quality, 3 representing minimal quality, 5 representing good quality, and 7 representing excellent quality in administrative practices. Items are comprised of 2 to 5 indicator strands. Each indicator is aligned with the 1-7 Likert scale and rated as either Yes orNo based on the program’s ability to meet the indicator criteria.
The PAS assessments included in this analysis were conducted by certified PAS assessors. To become certified, PAS assessors must first achieve reliability (a score of at least 86%) on a test conducted after four days of training on the tool. Next, they must conduct two PAS assessments within three months of reliability training. The completed assessments are reviewed by PAS national anchors for consistency, accuracy, and completeness. The data for this study consisted of approved PAS assessments collected during the certification process from 693 center-based early care and education programs representing 31 states and the District of Columbia.
FINDINGS
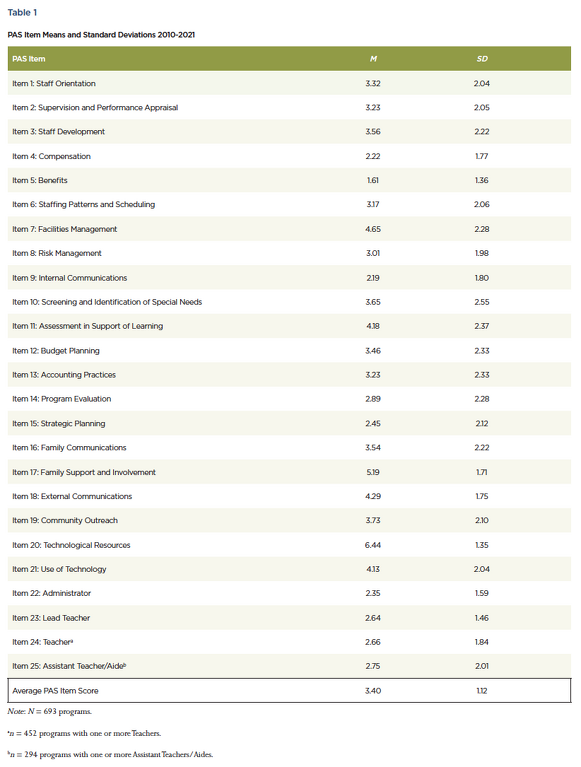
The average PAS item score for this sample was calculated at 3.40, with a standard deviation of 1.12. Mean individual items’ scores ranged from 1.61 (Benefits) to 6.44 (Community Outreach). Overall, the results of the data analysis suggest that most programs do not have well-developed administrative practices in place to support program sustainability and long-term quality. Table 1 provides the means and standard deviations for all item scores as well as the average PAS item score. As noted in the table, the majority of programs scored between the good and excellent range on Family Support and Involvement and Technological Resources, but most scored below minimal quality for Compensation, Benefits, Internal Communications, Program Evaluation, Strategic Planning, as well as all four roles contained within the Staff Qualifications subscale (Administrator, Lead Teacher, Teacher, and Assistant Teacher/ Aide).
OUTCOMES
What are the strengths of programs?
To better explore aggregated strengths, data were examined at the indicator level to see in which areas programs demonstrated practices at the level of quality consistent with administrative effectiveness and program sustainability. Specifically, we looked at indicators where at least 75% of the programs received a positive (Yes) rating at the 5 or good level of quality. Out of 316 total PAS indicators, only 16 in the sample met this criterion. Program strengths are summarized below:
- Administrators understand the importance of professional development (PD) and support their staff by allocating time and resources for PD. Fully 87% of programs provided on-site or paid for off-site staff development for all teaching, support, and administrative staff.In addition, 92% of programs had information regarding publicly-funded professional development opportunities posted and/or communicated to staff on an ongoing basis.
- Overall the facilities are well managed.Fully 89% of programs demonstrated at least two examples of routines for maintenance of the facility; 91% of programs had space with adult-sized furniture provided for staff use during breaks, meetings, conferences, and preparation time; and 91% of programs had separate administrative office space available on-site allowing for private conversations and meetings with staff and families.
- Some aspects of risk management are strong.Specifically, 84% of programs had information about individual children’s chronic medical conditions kept in the children’s classrooms, while 90% of programs had at least one staff person certified in CPR and First Aid assigned in each classroom.
- Administrators demonstrate commitment to family support and involvement.Fully 93% of programs invited families to visit in the classroom at any time, and 87% of programs offered at least five family supports (such as book and toy lending library, information and referral services for families, adult classes, family meetings and support groups, home visits, family resource center, and convenience services).
- Technology—both technological resources and use—supports effective program operations. Fully 89% of programs had multiple computers that were available for teaching and administrative staff; 96% of programs provided Internet access for teaching and administrative staff; 97% of programs had administrative staff who used technology for internal and external communications; and 84% of programs had teaching staff who used technology in their work with children and families at least once a week.
What are the areas in need of improvement?
To understand where programs would benefit from increased resources and support, data were examined at the indicator level to see in which areas programs consistently demonstrated practices below the minimal level of quality. Specifically, we looked at indicators where less than 75% of the programs received a positive (Yes) rating at the 3 or minimal level of quality. Out of 316 total PAS indicators, there were 27 that met this criterion. Areas for improvement are summarized below:
- Staff orientation is an area in need of support. Almost half (43%) of the programs did not have an orientation for new staff that included receiving a job description, employee handbook, parent handbook, and personnel policies; 53% of the programs did not have written orientation procedures; and 40% did not consistently implement staff orientation.
- Compensation and staff benefits are inadequate to support staff well-being and reduce turnover. Just over half (53%) of the programs did not have a written salary scale differentiated by role, education and specialized training; 40% of programs did not provide all employees with a salary increase within the past two years. The vast majority (68%) of the programs did not provide all employees with 6 or more paid sick/personal days within the first year of employment; 65% of the programs did not provide all employees with 5 or more paid vacation days; 53% of the programs did not give all full-time employees the option of contributing to a retirement plan. Further, only 50% of the programs gave all full-time employees the option of purchasing a health insurance policy with the employer paying a portion of the cost.
- Internal communications do not foster inclusive leadership, productive meetings, or collaborative teaching teams. More than a third (35%) of programs did not involve staff in planning center-wide staff meetings; 38% of programs did not keep minutes of topics discussed and decisions made at staff meetings; and 47% of programs did not have a written conflict resolution policy regarding the handling of staff disputes.
- Fiscal practices—both budgeting and accounting—need strengthening to achieve program sustainability. Over a quarter (26%) of programs reported that the Administrator was not even minimally involved in developing the program’s operating budget, while almost a third (32%) of programs did not have a current year operating budget, quarterly income and expense statements, or even one example of an accounting practice serving as a fiscal check-and-balance.
- Program evaluation by staff and families is lacking. Nearly half (47%) of programs did not have an assessment tool used by staff to evaluate the overall program; 30% did not have an assessment tool used by parents to evaluate the overall program; and 66% did not include staff and parent evaluations in programmatic decision making.
- Strategic planning is an area for potential growth. Two-thirds (66%) of programs did not have a written business plan or strategic plan that included a needs assessment, plan for services, short- and long-term goals, and strategies to achieve goals.
- Staff qualifications are consistently low. For example, while 85% of programs had an Administrator with a minimum of an associate’s degree, 34% of Administrators had less than 21 semester hours of college credit for early childhood education coursework and 54% of Administrators had less than 9 semester hours of college credit for leadership or management coursework.
DISCUSSION
Not surprisingly, many programs appear to be struggling with organizational practices that require significant financial resources, like offering salary increases, providing retirement benefits and enough sick/personal and vacation days to prevent staff burnout, or hiring staff with sufficient specialized education and training in early childhood education to achieve mastery of competencies.
However, there are also other administrative practices that many programs do not have in place that require little financial investment but do require specialized knowledge and skills in organizational leadership. These include undertaking a phased orientation and onboarding process for new staff; implementing strategic planning and program evaluation with key stakeholders to assure program sustainability and long-term quality; creating a transparent and equitable salary scale; utilizing communication processes and structures that support inclusive leadership and shared decision-making; implementing sound budgeting and accounting practices; and creating a more comprehensive risk management plan to reduce the center’s liability. and minimize harm. While most programs provide professional development for staff, few programs take a systemic view and provide support for career development by providing salary increases linked to credit-bearing professional development or the attainment of professional credentials. Taken as a whole, this window on administrative practices over the past decade highlights many strengths in program management while identifying the specific areas in program leadership that should be targeted when designing opportunities to support the professional growth of program administrators.
Table 1
PAS Item Means and Standard Deviations 2010-2021
REFERENCES
1Institute of Medicine and National Research Council. (2015). Transforming the workforce for children birth through age 8: A unifying foundation. The National Academies Press.
2Kirby, G., Douglass, A., Lyskawa, J., Jones, C., & Malone, L. (2021). Understanding leadership in early care and education: A literature review. OPRE Report 2021-02. Office of Planning, Research, and Evaluation, Administration for Children and Families, U.S. Department of Health and Human Services.
3McCormick Center for Early Childhood Leadership. (2010). Connecting the dots: Director qualifications, instructional leadership practices, and learning environments in early childhood programs. Research Notes. McCormick Center for Early Childhood Leadership, National Louis University.
4Talan, T. N., & Bloom, P. J. (2011). Program Administration Scale: Measuring Early Childhood Leadership and Management (2nd ed.). Teachers College Press.